


 Graphics shout about reaching the bottom, however, despite all the bullish factors, the interest in the market is still minimal.
Markets unfold in three ways:
- After the surrender;
- After a strong trending setup for explosive growth;
- Slowly turning over.
Surrender to “facilitate” the purchase of the reversal. A slow turn is the most difficult to find entry points.
The graph $BTC has all the signs of bottoming.
- Surrender (November-December);
- Double rebound from the long-term trend line in December and February (moving average over 200 weeks);
- A break out from a higher bottom on high volume (for now).
Strait on the last attempt of pressure would increase the probability of reaching the bottom.

A strong movement, which would have filled the gap marked in the screenshot, is a matter of time. This growth may happen due to purely technical indicators, he may not need a fundamental catalyst, or change in the market structure.

The following is the weekly chart. Pair $BTC twice in a row felt resistance at the moving average for 200 weeks (now it is located on 3350). The volume this week looks weak.

In the short term $BTC will move in the area of 3700-4200.
Resistance: 4000, 4200, 4400, 5000, 5500.
Support: 3800, 3700, 3600/3550, 3450, 3350, 3150, 3000.
If the price will go above 4200, it can move QUICKLY. Monitor the levels as it was recently on the 3700. The key level for purchases noted below 3700. ANY LONG POSITIONS below 3550.

- The Cash App from Square will receive support Lightning;
- Binance accept credit cards;
- Introduction piatogo gateway on Binance;
- The Revival Of Mt Gox;
- A study of the crypto market company Facebook;
- Possible to run Bakkt in March;
- New platforms and applications (Dharma, Abra, etc.);
- Fidelity launches service for institutional investors.
As for negative factors, most of them, which influence the fall of the market in the last quarter of 2018, is no longer relevant, or have a much weaker effect. The market should still expect a strong pressure of the SEC in respect of ICO. But the overall picture has improved.
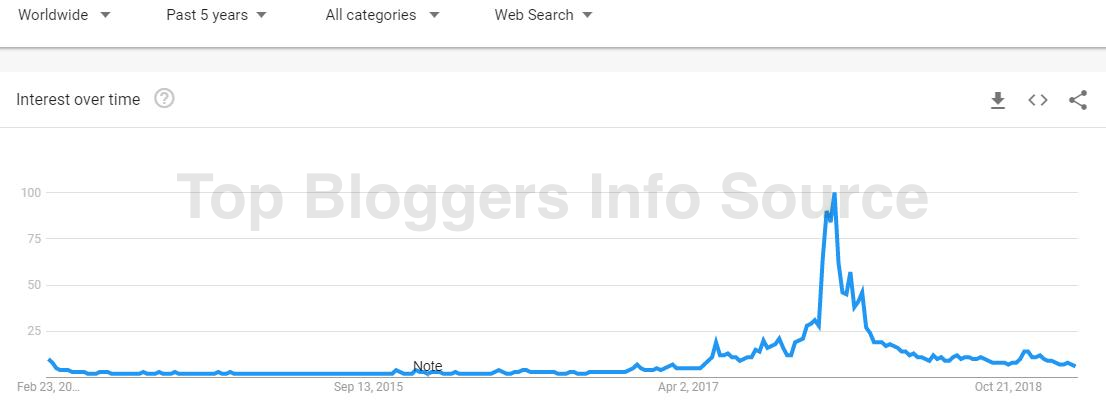
The interest of individual market participants now gone, so the trading volume is very much reduced. Google trends for the query Bitcoin are at levels April 2017, and the number of tweets at the bottom of 2016. The steady uptrend beyond $6 000 require the return of public interest. It will take time.

Prices may fall again. In the end, the demand for Bitcoin almost entirely a speculative one, and the natural sellers (miners and exchanges) will always sell. You can consider short-term long positions above and below 3550 3700 (key level) the key level of 4200 for sale. Graphics shout about reaching the bottom, but despite all the bullish factors, the interest in the market is still minimal. If the price will go down from 3550 to increase the probability of updating the bottom. The future depends on price movements.
My analytical position on the market two months ago was virtually the same, although the conditions (and mood) of that time has been improved (for example, the expected deviation of the ETF on February 27 has been postponed for a period that can reach up to 240 days).
Alex Kruger
Source


