


2018 was the worst for the price of bitcoin over the past seven years. However, the analyst believes the CoinDesk Omkar Godbole, now the technical picture is that soon BTC may again overcome the mark of $4200, which will open the way towards $5000.
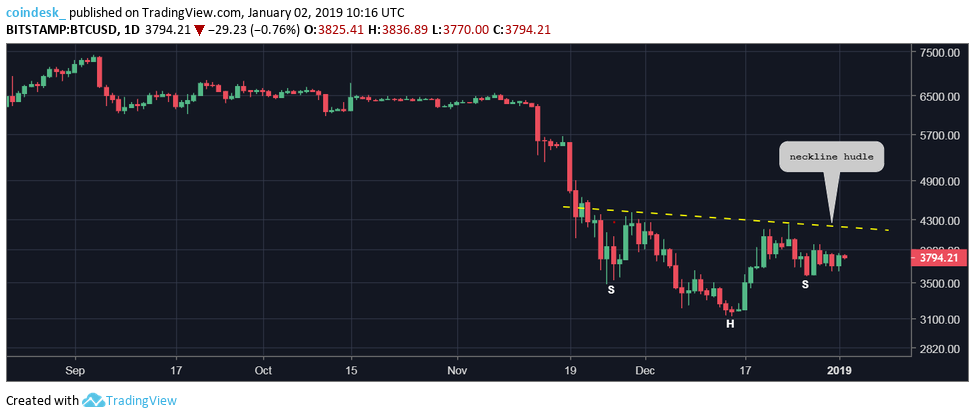
Daily chart

On the daily time frame seen a reversal pattern “Inverted head and shoulders” neckline at $4180. However, this line is tilted down, which could indicate some indecision of the bulls.
As is known, the approximate potential future price movements is measured by the distance between the price low of the head and the neckline. Thus, the closing daily candle above $4180 price will open the doors to the levels around $5200.
The three-day schedule

The situation on the higher timeframe as a whole in favor of buyers. Therefore, the above resistance $4180 can be tested in the near future.
It is worth noting that the price of BTC holds above the December low ($3122). Give optimism and a bullish divergence on the RSI indicator.
The four-hour chart
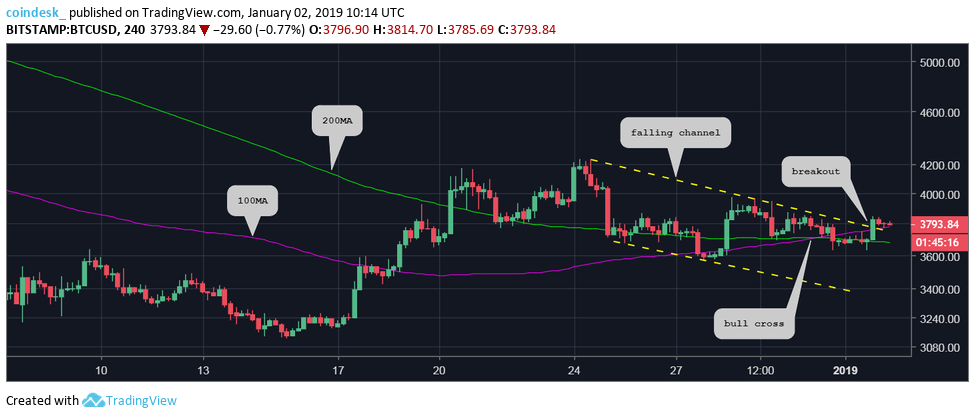
Simple moving average (MA) with a period 100 is located above the MA200. Thus, the path of least resistance is laid up. The confirmation of this thesis is the breakout of the upper line of the downward price channel.
To radically change the market sentiment maybe the failure rates below $3556 corresponding to at least 27 December. This scenario should not be discounted, because the NVT Ratio indicator remains in the overbought zone (currently it is at around 114; overbought market — value above 100).
While a limit order at $5000 have not been executed, the log ForkLog offers to remember the main events of 2018.
Source


